
Driver-Based Cash Flow Projections for SaaS: A Load Analysis, Not a Pretty Span
Driver-based cash flow projections for SaaS work like a bridge load analysis. Model the real loads your cash must carry, not the smooth span you wish you could print.
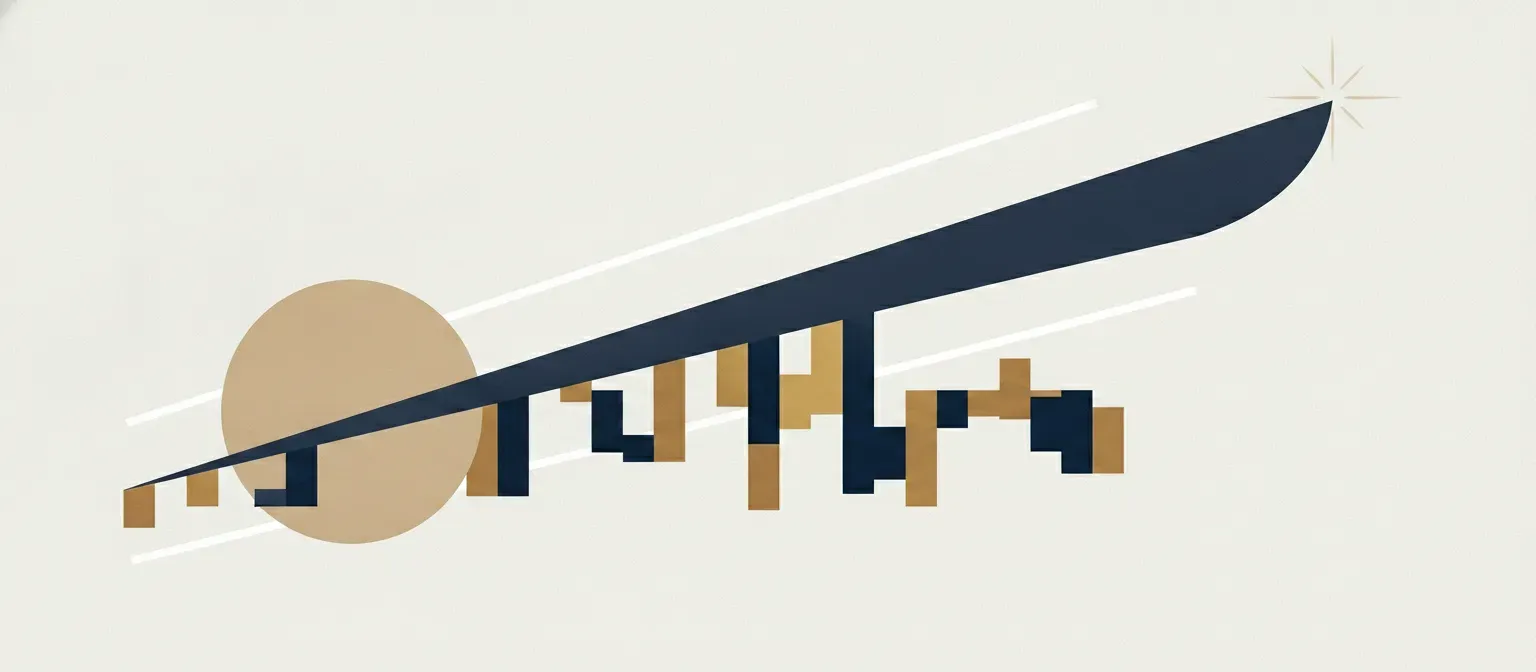
Cash flow projections are a forward view of the real money moving into and out of your bank, and a driver-based version treats that view the way a structural engineer treats a bridge: as a load analysis, not a pretty span. You do not design a bridge by drawing a graceful deck and hoping it holds. You name every load it will carry, then size the beams to carry them.
A revenue line pulled up and to the right is the graceful deck. It looks sound. But no one has reviewed whether it can carry the weight that will cross it.
Point the engineer’s review at your cash.
A forecast that ignores the loads it must carry is a deck with nothing underneath it.
The load analysis you skipped
When an engineer designs a bridge, the totality of forces it must tolerate is the structural load, and that load divides three ways. Dead load is the weight of the structure itself. Live load is the traffic crossing over, the moving weight that braking and acceleration keep changing. Environmental load is the violent, hard-to-predict part: winds, floods, the sudden force of an earthquake.
A driver-based cash flow projection runs the same analysis on your money.
Dead load is your fixed weight: payroll, the office and the tools, all the spending that arrives whether or not a single customer signs. It sits on the foundation every month and never lets up.
Live load is the moving traffic. New customers crossing the deck, the rate at which they leave, the value each one carries, the timing of when an invoice turns into collected dollars. This load changes week to week, and like the traffic on a real bridge, it is the part everyone gets wrong.
Environmental load is the shock you cannot schedule. A big account that pays well over a month late. A deal that goes away the week you counted on it. The slipped collection that arrives like a sudden wind against a slender span.
Size your forecast for only the dead load, the smooth predictable part, and the first heavy month of real traffic will crack it.
Why the smooth revenue span fails
The most trusted number in startups is annual recurring revenue, and it acts like a beautiful rendering with no load analysis behind it. ARR is what you sold. Cash is what you banked. The gap between those two is where the deck gives way.
Three forces pull them apart.
Start with timing. The metric counts a sale the moment you book it, while cash counts it the day the customer pays. A fresh annual contract can show a full year of revenue while the dollars sit in receivable for two months. Your days sales outstanding decides how far that span has to reach with no support holding the middle.
Then there is what counts at all. The top line sweeps in deals you have closed but not collected, and a few that will evaporate before the year is out. Cash is a stricter engineer. It signs off only once the money has moved.
The hardest pull is money out. You pay to acquire a customer now and collect from them later, so fast growth can drag the bank balance down even while the top number rises. That is the live load nobody weighed.
A revenue line that just trends up forecasts your story, not your cash.
The famous collapse
Engineers still study the Tacoma Narrows bridge, the one built to withstand winds far stronger than the wind that pulled it apart. The designer left a force out of the analysis. The span was elegant right up to the moment it twisted itself to pieces.
I have seen a software company do the same thing with cash.
The recurring revenue line was the slide every founder wishes they could pin up. Up and to the right, smooth and clear. The cash had a different story the whole time. They sold annual contracts and invoiced monthly, so the money came in while the full year was counted at once. They spent heavily to acquire each customer, up front, in full. And their collection timing kept stretching later as they signed larger accounts that paid on their own schedule.
Both lines were true at once. Revenue was up, cash was sinking, and only one of them made the pitch. By the time the bank balance forced the hard conversation, the buffer everyone assumed was there had already been spent. No one had run the load analysis below the growth, so no one saw the failure coming until the money was already gone.
How to build the projection like an engineer
You do not need a baroque model that takes three days to format and a prayer to open. You need one that names every load and ties it to a member that carries it.
Start with the loads that move money in. List your leads, the rate at which they convert, the value of each new customer, and the rate at which customers leave. That gives you what you sold. Then layer the timing on top, the days between an invoice and collected dollars, which turns sold into banked. The gap between those two lines is the part of the deck with nothing under it yet.
Run the same analysis on money out. List the spending by cause, not as one flat figure: acquisition, payroll, and the tools you pay for. Connect each line to the driver behind it, the way a beam transfers its load down to the footing.
Then test it weekly, not once a year.
The weekly cadence carries the load. A near-term cash flow model finds the immediate crunch that an annual view papers over, the same way an engineer checks a structure against the worst storm of a long return period instead of an average sunny day. When a collection slips or a deal lands, you change the input and watch the cash respond in real time. The projection is no longer a rendering on the deck. It becomes the load analysis you run the company on.
banked cash = (leads x conversion x value), set by collection days, minus your fixed dead load
Frequently asked questions
What is the difference between a cash flow projection and ARR?
ARR is annual recurring revenue, a measure of what you have sold and would earn if nothing changed for a year. A cash flow projection forecasts the actual dollars moving through your bank, including the timing of when customers pay and when you spend. ARR measures momentum. The projection measures the load your cash must carry.
Why build driver-based cash flow projections instead of a simple revenue line?
A revenue line that trends up is a graceful deck with no load analysis behind it. Driver-based cash flow projections connect every dollar of projected cash to an input you can name, like leads, conversion, the rate at which customers leave, and collection timing. Change one input and the cash line moves, so you can test an assumption rather than hope it holds.
How far out should SaaS cash flow projections run?
Run a near-term view weekly and a longer view monthly. The short, near-term cash flow model finds the immediate crunch, the slipped collection or the bumpy month, that an annual number covers up. Pair it with a longer monthly forecast for fundraising and planning.
Can a fast-growing company still run out of cash?
Yes, and it is more common than founders expect. Growth costs money up front and pays back later. If you acquire customers now and collect from them late, a rising revenue figure can pull the bank down at the same time. That is a live load nobody weighed, and modeling the cash below the growth is the only way to see it early.
The bottom line
ARR sells the company. Cash is the load that holds it up. Build your cash flow projections from the drivers below the number, run the analysis on every load the structure must carry, and the gap between what you sold and what you banked is no longer a sudden collapse at the bank. It becomes a number you sized for on purpose.
CX Cash exists for this work. We track the dollars you collect, connect them to the drivers that move them, and run the load analysis below your growth before the deck cracks in a board meeting no one enjoys. You should know where the money is going.
Take the free near-term cash flow model and forecast template, join CX Cash, and share this with the founder you know who is still designing the company to a pretty span.
More in Cash Flow Forecasting & Projections
Accounts Receivable Forecast: Why One Number Is a Forecast That Always Misses
An accounts receivable forecast is not one number. Learn to run it like a weather model, updating AR and AP timing with real data so the cash gap never blindsides you.

The Cash Conversion Cycle Explained: Read It Like a Race Split
The cash conversion cycle is the clock on every dollar, from the start line where you pay suppliers to the finish where customers pay you. Here is how to read your splits and run a negative one.

Cash Flow Forecasting Techniques: Send the Right Scout Down the Road Ahead
The cash flow forecasting techniques you actually need read the ground ahead like scouts. Pick the one that fits the distance and the time you have, and your forecast stops lying to you.